Most succession planning programs are measured by activity, and activity flatters everyone. Reviews are held. Boxes are filled in. Slides are produced. The leadership team nods, the deck gets archived, and everyone agrees succession is “covered” until a critical role suddenly opens and the bench turns out to be thinner than the chart suggested.
The problem isn’t that organizations skip measurement. It’s that most measure the wrong things, or measure them in ways that surface real risk only after it’s too late to act.
A succession plan may show successors named for every critical role, but that doesn’t always mean the bench is deep, readiness is improving, or the pipeline is actually getting stronger year over year. Coverage on paper and coverage in practice can look very different. The only way to close that gap is a tighter set of succession planning metrics that measure what leaders actually need to know.
DDI’s Global Leadership Forecast research has repeatedly found that only around 11% of HR professionals describe their organization’s leadership bench as strong, and Deloitte research shows 86% of leaders call succession an urgent or important priority while only 14% believe they do it well. The biggest reason for that gap isn’t effort. It’s measurement. Programs that can’t measure bench depth, readiness progression, and internal fill rate can’t improve them either.
The right succession planning metrics turn the conversation from “did we run a talent review this year?” to “is the pipeline actually getting stronger?” That shift separates compliance-grade succession planning from strategic succession planning, and it’s exactly the lens executive teams and boards are starting to apply.
BullseyeEngagement’s succession planning software, AI Advisor, and Leadership Human Capital BI Dashboard are built to track these metrics continuously, so leaders can see risk, coverage, and pipeline health in real time.
Why succession planning metrics matter more than ever
The cost of weak succession measurement is documented. Harvard Business Review estimates that poorly managed CEO and C-suite transitions destroy close to $1 trillion in market value each year across the S&P 1500, and that better succession practices could lift company valuations and investor returns by 20% to 25%. Further down the org chart, where a single critical-role departure can stall a region, a product line, or a major customer relationship, the damage usually goes unmeasured entirely.
For CHROs, the measurement layer matters for 3 reasons:
- It makes succession planning defensible. Boards and CEOs want evidence the pipeline is improving, and an assurance is no longer enough.
- It exposes risk early. Metrics catch thinning benches, slow readiness progression, and HiPo flight risk months before they become open roles.
- It connects succession to investment decisions. Without metrics, it’s nearly impossible to justify development spending, hiring strategy, or workforce planning choices tied to leadership continuity.
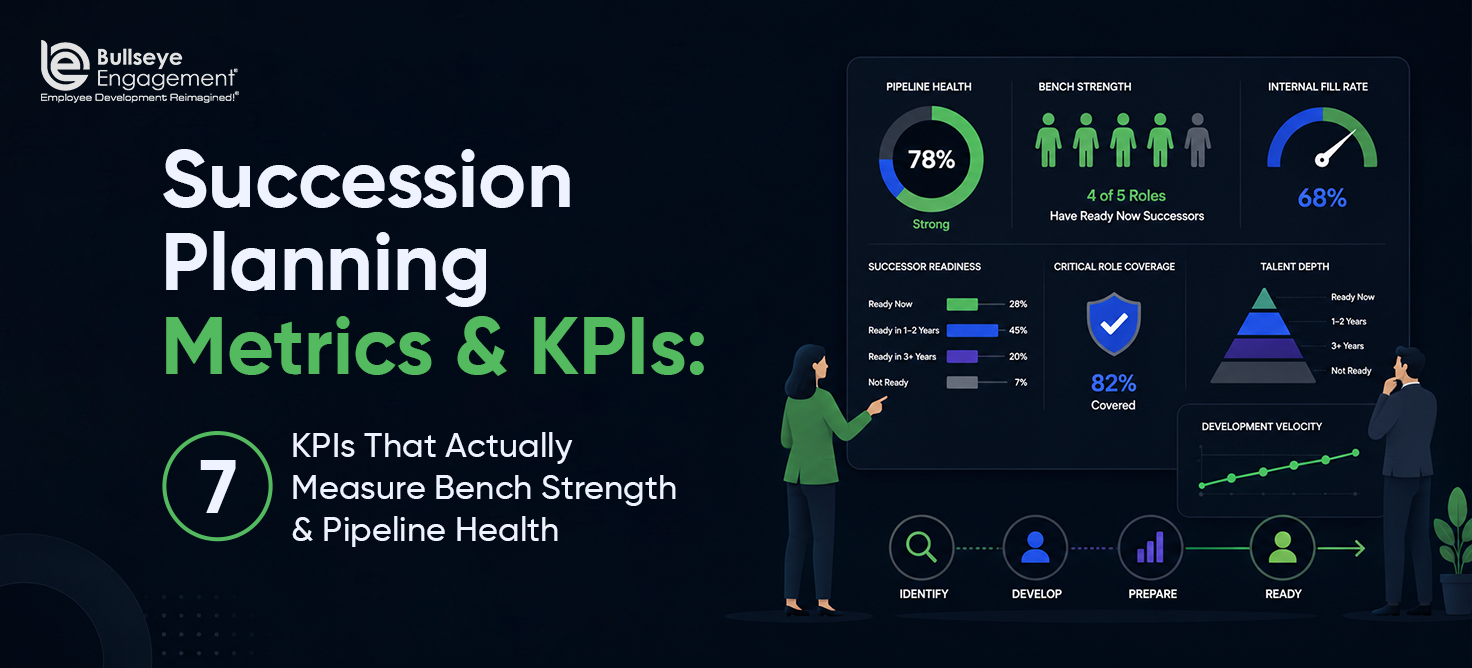
The good news: you don’t need a hundred metrics. A focused set of 7 KPIs, tracked consistently and reviewed at the right cadence, is enough to give executive teams a real picture of pipeline health.
Leading vs lagging: the distinction most succession dashboards miss
Before the list, one framing that changes how you read every number on it.
Lagging metrics tell you what already happened. Internal fill rate and successor turnover are outcomes. By the time they move, the underlying cause is months old.
Leading metrics tell you what’s about to happen. Coverage, bench depth, readiness progression, and development plan movement all shift before the outcomes do. A bench that thins in Q1 becomes an external hire in Q4.
A dashboard built only on lagging metrics is a rear-view mirror. The 7 KPIs below deliberately mix both, so you can see where the pipeline is heading and prove where it’s been.
The 7 succession planning KPIs that actually matter
These are the metrics modern succession programs rely on. They cover coverage, depth, readiness, internal mobility, and risk: the 5 dimensions that together describe whether your pipeline is getting stronger or weaker.
1. Critical role coverage rate
What it measures: The percentage of critical roles that have at least 1 identified, ready-now (or ready-soon) successor.
Formula: (Critical roles with at least 1 ready-now or ready-in-1-year successor / total critical roles) x 100
Why it matters: Coverage is the most basic measure of preparedness. If 20% of your critical roles have no ready successor at all, you have visible exposure that should be addressed before anything else.
How to use it: Segment by function, business unit, and tier before you average anything. The headline number can look acceptable while specific functions are quietly uncovered.
Healthy benchmark: 80% or more of critical roles with at least 1 ready-now or ready-in-1-year successor.
2. Bench strength (successor depth)
What it measures: The average number of viable successors per critical role, weighted by readiness horizon.
Formula: Total viable successors across critical roles / total critical roles (report alongside the % of roles with 2+ successors)
Why it matters: Coverage tells you a name exists. Bench strength tells you whether the plan survives contact with reality. A role with 1 successor and no backup is 1 resignation away from exposure, even though it looks covered.
How to use it: Track the distribution, since averages hide thin spots. A team with 4 successors for 1 role and none for 3 others has the same average as a healthy bench and none of the resilience.
Healthy benchmark: At least 2 viable successors per critical role, with at least 1 in a ready-now or ready-in-1-year horizon.
3. Internal fill rate for leadership roles
What it measures: The percentage of leadership and critical-role vacancies filled by internal candidates over a defined period, usually trailing 12 months.
Formula: (Leadership vacancies filled internally / total leadership vacancies filled) x 100
Why it matters: This is the cleanest outcome metric in succession planning. It answers the question executives actually want answered: “Is our pipeline producing leaders?” Internal fill rate also has cost, time, and engagement implications, since internal placements typically ramp faster and stay longer than external hires.
How to use it: Segment by role level (senior leader, director, manager) and by business unit. A high overall rate can mask weakness at specific levels.
Healthy benchmark: 60-70% internal fill for leadership roles is common across high-performing organizations, with stronger benchmarks (75%+) at director and below.
4. Time-to-readiness
What it measures: The average time it takes for an identified successor to move from initial designation to ready-now status.
Formula: Average (date successor reached ready-now status minus date of initial designation), across successors who progressed in the period
Why it matters: This metric tells you whether your development engine is actually working. If the same successors sit at “ready in 1-2 years” for 3 years running, readiness has stalled, and the pipeline has stalled with it.
How to use it: Track readiness progression at the individual level, then aggregate. Combine with development plan completion data to diagnose whether the issue is plan quality, assignment exposure, or sponsorship.
Healthy benchmark: Median time-to-readiness of 18-24 months for senior leadership roles, with measurable forward progression year over year.
5. HiPo and successor turnover rate
What it measures: The percentage of identified HiPos and named successors who voluntarily leave the organization over a 12-month period.
Formula: (Voluntary exits among HiPos and named successors / total HiPos and named successors) x 100, compared against overall voluntary turnover
Why it matters: If your HiPos and named successors are leaving at the same rate as the general workforce, or faster, your succession investment is leaking out the back door. This is also the metric that connects succession to retention strategy.
How to use it: Compare HiPo and successor turnover to your overall voluntary turnover rate. Drill into exits to understand whether the issue is compensation, development, sponsorship, or engagement, which is often diagnosable through your engagement survey data.
Healthy benchmark: HiPo and successor turnover at or below 50% of overall voluntary turnover. If they’re leaving at parity, you have a problem.
6. Successor diversity and representation
What it measures: The demographic representation of the succession pipeline at each readiness horizon, compared to the organization overall.
Formula: (Successors from a given group / total successors) x 100, compared at each readiness horizon against the eligible workforce
Why it matters: A pipeline that doesn’t reflect the workforce will produce a future leadership team that doesn’t either. Tracking this metric is the only way to catch demographic skew early enough to act on it through identification, sponsorship, or development investment.
How to use it: Compare succession population demographics to workforce demographics at each level. Look for gaps that widen as you move from “ready in 3+ years” to “ready now”. That pattern signals bias filtering people out at the readiness stage.
Healthy benchmark: Succession pipeline demographics roughly match (within a few points of) the underlying eligible workforce at each level.
7. Development plan completion and progression rate
What it measures: The percentage of identified successors with an active development plan, and the percentage of those plans achieving meaningful milestones: stretch assignments completed, competency growth demonstrated, readiness horizon improved.
Formula: (Successors with an active development plan / total named successors) x 100, paired with (plans hitting at least 1 milestone in the period / active plans) x 100
Why it matters: Succession identification without development is just labeling. This metric tells you whether the program is actually building capability.
How to use it: Track both the existence of development plans (a coverage metric) and progress against them (an outcome metric). Pair with the talent development and competency management data already in your platform.
Healthy benchmark: 100% of named successors with an active development plan; 70% or more achieving at least 1 defined milestone per year.
How to use these metrics together
No single metric tells the whole story. The real insight comes from looking at them in combination. A few common diagnostic patterns:
- High coverage + low bench strength = You have successors named, with no backups. One departure away from exposure.
- High coverage + low internal fill rate = Your plan looks good on paper, and you’re still hiring externally. Either successors aren’t ready when needed, or hiring managers don’t trust the list.
- Low time-to-readiness + low HiPo turnover = Your development engine is working.
- High HiPo turnover + lagging development progression = You’re at high risk of pipeline collapse. Act now.
- Successor diversity diverging from workforce diversity = Bias is filtering candidates out somewhere in the process. Audit identification and readiness rating.
These patterns also diagnose the failure modes we covered in why succession plans fail. A plan that’s failing usually shows up in the numbers a year before it shows up in a vacancy.
This is exactly the kind of pattern recognition modern dashboards are built for. Static spreadsheets can’t show these relationships in real time.
Set the review cadence before you set the targets
A metric nobody reviews is decoration. Each KPI has a natural rhythm, and putting the right number in front of the right audience at the right frequency is what turns measurement into action:
| Metric | Review cadence | Primary audience |
| Critical role coverage rate | Monthly (HR), quarterly (executive team) | CHRO, business unit leaders |
| Bench strength | Monthly (HR), quarterly (executive team) | CHRO, talent management |
| Internal fill rate | Quarterly | Executive team, board |
| Time-to-readiness | Quarterly | Talent management, HRBPs |
| HiPo and successor turnover | Monthly | CHRO, talent management |
| Successor diversity | Quarterly | CHRO, executive team, board |
| Development plan progression | Monthly (HR), quarterly (managers) | HRBPs, people managers |
The pattern: leading indicators (coverage, depth, turnover, plan progression) get monthly internal attention so problems surface fast. Outcome metrics (internal fill, diversity, time-to-readiness) get quarterly executive attention, with a deeper annual review tied to talent calibration.
How to build your baseline in the first 90 days
If you’re starting from spreadsheets, don’t try to stand up all 7 metrics at once. A realistic sequence:
Days 1-30: coverage and depth. Confirm the critical role list, then count successors and readiness horizons per role. These 2 metrics need no historical data, so they’re available immediately, and they expose the most urgent gaps.
Days 31-60: turnover and internal fill. Pull trailing 12-month data from your HRIS for HiPo exits and leadership vacancies. Both are backward-looking, so 1 data pull builds the baseline.
Days 61-90: readiness progression, development, and diversity. These require tagging successors in a system and connecting them to development plans, which is where a platform starts paying for itself. Once the tagging exists, progression tracks automatically from that point forward.
By day 90 you have a defensible baseline for all 7 KPIs and a first executive dashboard. Every quarter after that measures movement against it.
What modern succession measurement looks like
The strongest succession programs share a few measurement features:
- They track metrics continuously, and treat annual reviews as calibration points.
- They segment by function, level, and business unit, since headline rates hide the real story.
- They combine coverage metrics (point-in-time) with progression metrics (over time).
- They build board-ready dashboards once, and stop reconstructing decks every quarter.
- They use the data to drive specific actions: development investments, hiring strategy, retention conversations.
BullseyeEngagement’s Leadership Human Capital BI Dashboard and AI Advisor make this possible by pulling succession, performance, engagement, and workforce data into a single, continuously updated view. Inside the succession planning module, the Talent Card consolidates each employee’s competencies, Talent Matrix placement, risk assessment, development progress, and succession candidacy on one screen, and the Risk Matrix combines coverage data with talent risk signals to flag the roles that pose the biggest continuity exposure. That’s the raw material every metric above draws from.
How BullseyeEngagement helps measure succession planning
One input. Continuous measurement. Actionable output.
Step 1. Define critical roles and segments. Configure which roles, levels, and business units you want to track succession metrics against.
Step 2. Capture coverage and bench depth. AI Advisor surfaces ranked successors per critical role and measures depth at every readiness horizon.
Step 3. Track readiness progression over time. Watch successors move (or fail to move) through readiness horizons, with progression data tied to development plans and gap analysis.
Step 4. Monitor HiPo and successor turnover. Connect succession data to engagement signals and exit patterns to catch flight risk early.
Step 5. Surface diversity and representation. Compare pipeline demographics to the eligible workforce automatically, as part of the standard view.
Step 6. Generate executive and board-ready dashboards. Pre-built views in the Leadership Human Capital BI Dashboard replace weeks of manual deck-building.
This is the same shift we’ve written about across the cluster: from static, point-in-time talent processes to continuous, structured, action-driven talent management. See why succession plans fail and how to identify high-potential employees for the full picture.
Why this matters for CHROs and executive teams
For CHROs, succession metrics are no longer an HR-internal reporting exercise. They’re how the leadership team gets honest about pipeline health, how the board gets confidence that continuity risk is being managed, and how investment decisions in development, hiring, and workforce strategy get justified.
A modern succession metrics layer helps CHROs answer the questions executives actually ask:
- Where are we exposed, and where are we strong?
- Is the pipeline getting better year over year, or just busier?
- Are we promoting from within at the rate we should be?
- Are we losing the talent we’ve invested in?
- Does the pipeline reflect the future workforce we want to build?
- Can we show the board where succession risk is heading next quarter?
Connected to Workforce Planning and Performance Management, these metrics turn succession from an annual ritual into a strategic capability. And if the measurement conversation surfaces that your current tooling can’t keep up, our guide on how to choose the right succession planning software covers what to evaluate.
Common mistakes in measuring succession planning
Even strong programs stumble on a few recurring measurement mistakes:
- Reporting only coverage, without depth. Coverage alone hides key-person risk.
- Reporting only headline numbers. Segment by function, level, and business unit. That’s where the real story lives.
- Tracking activity while calling it outcomes. “Reviews completed” measures effort. “Internal fill rate” and “time-to-readiness” measure results.
- Ignoring HiPo and successor turnover. Without this number, you can’t tell whether the program is leaking talent.
- Measuring annually, acting reactively. By the time annual data shows a problem, you’ve often already lost the window to fix it.
- Failing to connect metrics to action. A dashboard nobody uses is just decoration.
FAQs
1. What are the most important succession planning metrics?
The 7 most important succession planning metrics are: critical role coverage rate, bench strength (successor depth), internal fill rate for leadership roles, time-to-readiness, HiPo and successor turnover rate, successor diversity, and development plan completion. Together they measure coverage, depth, readiness, internal mobility, and risk.
2. What is a good internal fill rate for leadership roles?
Most high-performing organizations target 60-70% internal fill for leadership roles overall, with rates of 75% or higher at the director level and below. Rates below 50% often signal that the succession pipeline isn’t producing ready leaders when roles open.
3. How do you measure bench strength?
Bench strength is the average number of viable successors per critical role, weighted by readiness horizon. A role with 1 named successor and no backups has weak bench strength even if it appears covered on paper. Aim for at least 2 successors per critical role, with 1 in a ready-now or ready-in-1-year horizon.
4. What is time-to-readiness in succession planning?
Time-to-readiness measures how long it takes for an identified successor to progress from initial designation to ready-now status. It’s one of the strongest indicators of whether your development process is actually working. A healthy median is 18-24 months for senior leadership roles, with measurable forward progression year over year.
5. Why is HiPo turnover a critical succession metric?
If your high-potential employees and named successors leave at the same rate as the general workforce, or faster, your succession investment is leaking out the back door. HiPo and successor turnover should typically run at no more than half the rate of overall voluntary turnover.
6. What is the difference between leading and lagging succession metrics?
Lagging metrics like internal fill rate and successor turnover describe outcomes that already happened. Leading metrics like coverage, bench depth, and development progression shift months before outcomes do, which gives leaders time to act. A healthy succession dashboard tracks both.
7. How often should succession metrics be reviewed?
Coverage, bench strength, plan progression, and HiPo turnover should be visible continuously and reviewed monthly inside HR. Outcome metrics like internal fill rate and diversity get quarterly executive review, with deeper annual reviews tied to talent calibration.
8. Can succession planning metrics be tracked automatically?
Yes. Platforms like BullseyeEngagement’s succession planning software combined with AI Advisor and the Leadership Human Capital BI Dashboard track these metrics continuously, eliminating the manual rebuilding that makes most succession reporting slow and reactive.
Ready to measure your succession pipeline the right way?
Activity-based succession reporting tells you what was done. Outcome-based succession metrics tell you whether the pipeline is actually getting stronger. The 7 KPIs above (coverage, depth, internal fill, time-to-readiness, HiPo turnover, diversity, and development progression) are the difference between a program that looks complete and a program that is.
BullseyeEngagement’s succession planning software, AI Advisor, and Leadership Human Capital BI Dashboard help organizations measure all 7 continuously, so leaders can spot risk early, defend investment decisions, and prove pipeline health to executive teams and boards.