Book Your Demo
Ready for a demo? You're in the right place.
You can also call us at
(888) 515-0099
to schedule a live demo.
Selected Clients


| Overall |
|
4.6 |
| Overall |
|
4.6 |
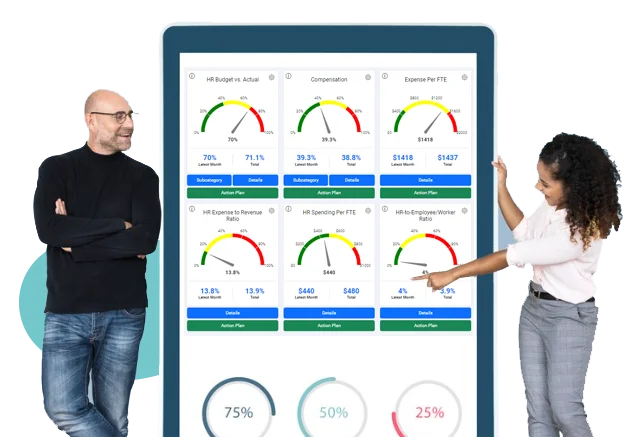
We'll demonstrate all or selected modules that will help you engage your employees and manage your company's human capital in a way that will impress not only your CEO, but your CFO.