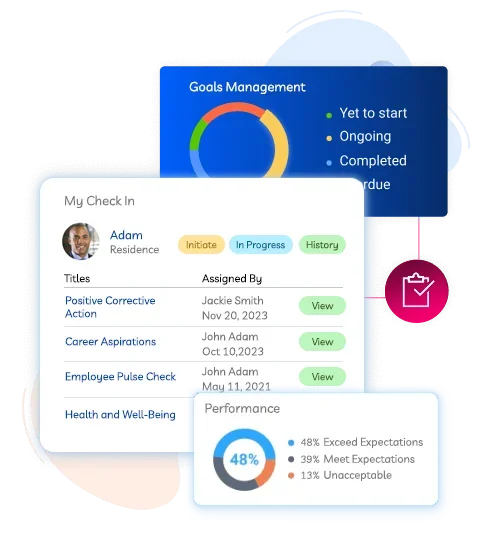
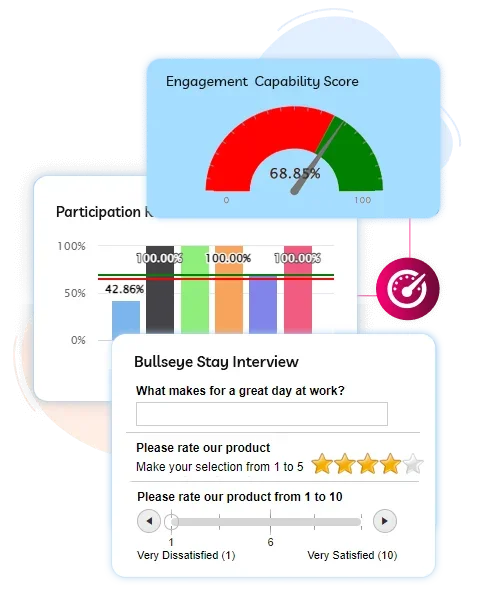
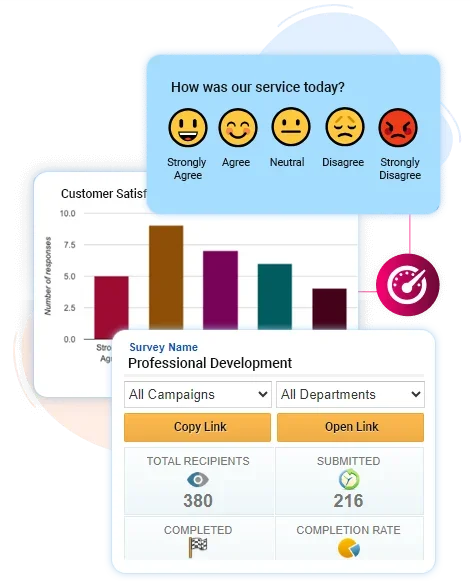
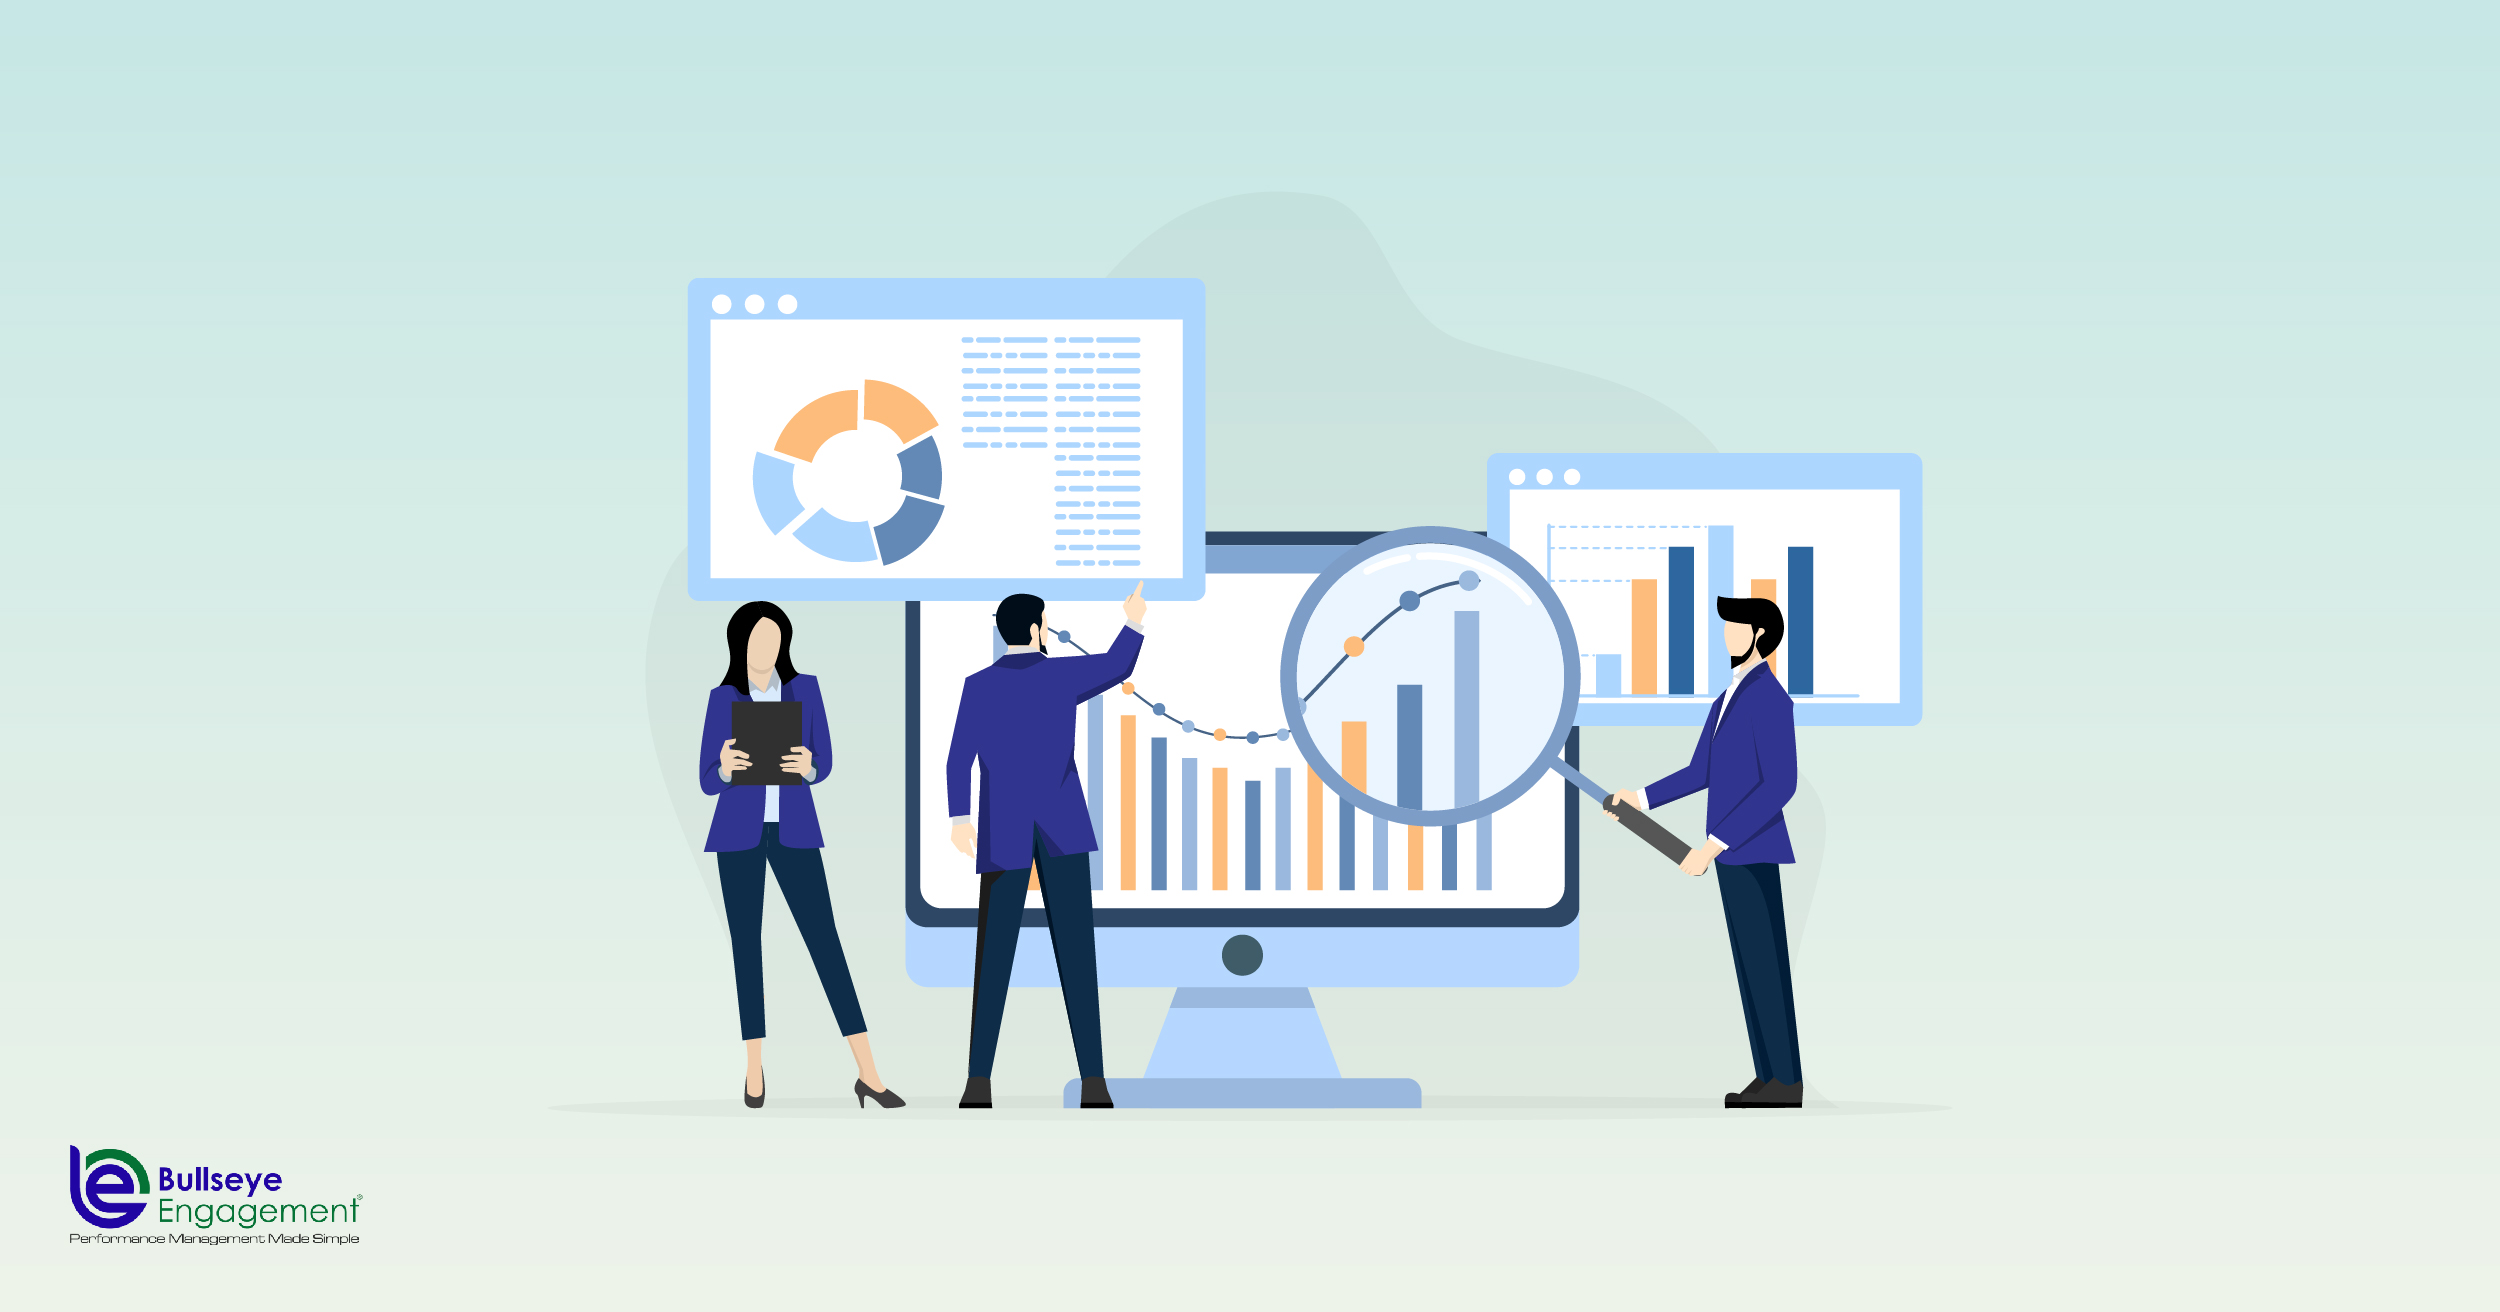
Thriving organizations will always rely on data-driven insights to navigate complexities, identify opportunities, and address challenges. This is where Business Intelligence (BI) dashboards emerge as indispensable tools, empowering professionals to transform raw data into actionable intelligence.
The ability to collaborate seamlessly and communicate effectively through BI dashboards has become paramount for enterprises across industries. BullseyeEngagement brings you the blog, that addresses the symbiotic relationship between collaboration, communication, and BI dashboards, and further comprehends how these elements converge to drive informed strategies and facilitate organizational growth.
Let’s discuss how BI dashboards transcend their role as data presentation platforms, evolving into dynamic hubs of interaction and knowledge exchange. From enhancing cross-functional collaboration to facilitating real-time insights dissemination, we will explore the multifaceted dimensions that underscore the significance of leveraging BI dashboards for cohesive teamwork and strategic decision-making.
Table of Content
The Basics of a Business Intelligence Platform
In the era of data proliferation, organizations are presented with a dual challenge: not only must they gather and store vast amounts of information, but they must also extract meaningful insights from this data deluge. Enter Business Intelligence (BI) platforms, the foundation upon which data-driven decision-making thrives. These platforms serve as the technological backbone that empowers professionals to translate raw data into actionable intelligence, fueling informed strategies and business growth.
At its core, a Business Intelligence platform is an integrated suite of tools, technologies, and processes designed to collect, analyze, and present data in a way that supports decision-making at all levels of an organization. From executives shaping high-level strategies to frontline employees seeking operational insights, BI platforms democratize data access and understanding.
Key Components of a Business Intelligence Platform
1. Data Integration
The first step in any BI journey involves collecting data from various sources, which can range from internal databases and spreadsheets to external APIs and cloud-based repositories. Data integration ensures a seamless flow of information, minimizing inconsistencies and errors.
2. Data Warehousing
Once collected, data needs a structured home. A data warehouse is a centralized repository that stores historical and current data from multiple sources. This storage method ensures data consistency and provides a foundation for robust analysis.
3. Data Modeling and Transformation
Raw data is often messy and unstructured. Data modeling involves organizing and structuring data to facilitate analysis. This step may include cleaning, transforming, and aggregating data to create a coherent dataset.
4. Data Analytics Tools
These are the engines of a BI platform. Analytics tools enable users to explore data, run queries, and generate reports and visualizations. These tools can vary from simple drag-and-drop interfaces to advanced programming-based platforms.
5. Dashboards and Visualizations
The front-facing side of BI, dashboards, and visualizations offer a user-friendly way to interpret complex data. Visual representations such as charts, graphs, and maps help users grasp insights quickly.
6. Collaboration Features
In the context of our blog theme, collaboration tools are pivotal. They enable users to share insights, annotations, and comments directly within the platform, fostering teamwork and collective understanding.
7. Mobile and Self-Service Capabilities
Modern BI platforms extend beyond desktop computers. Mobile compatibility and self-service options empower users to access and analyze data on the go, making timely decisions from anywhere.
8. Security and Governance
Protecting sensitive data is paramount. BI platforms incorporate security features to control data access, user permissions, and compliance with data protection regulations.
9. Scalability and Performance
As organizations’ data needs grow, BI platforms must scale to accommodate increased data volumes and user demands without sacrificing performance.
Using Business Intelligence Dashboards to Enhance Collaboration and Communication
Business Intelligence (BI) functions not merely as a tool for data analysis, but also as a dynamic platform that facilitates teamwork, decision-making, and strategic alignment. Here are the ways in which dashboards can revolutionize collaborative efforts within your organization:
Visual Data Representation: Breaking Down Complexities
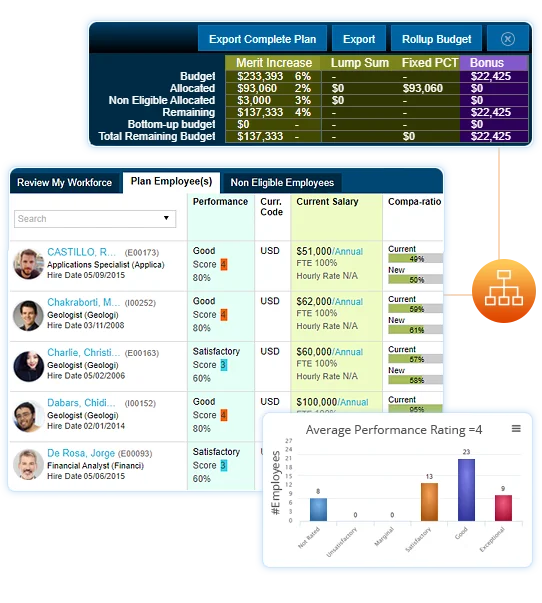
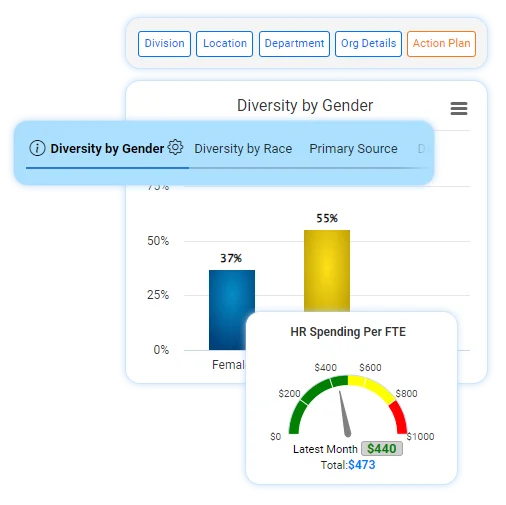
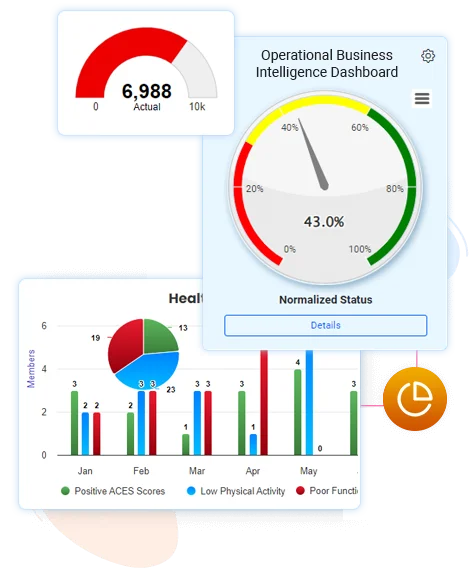
Numbers and statistics can often appear daunting, deterring effective communication among cross-functional teams. BI dashboards offer a solution by transforming raw data into intuitive visualizations, ranging from graphs and charts to heatmaps and infographics. These visual representations eliminate the barriers of data complexity, allowing team members from various backgrounds to grasp insights effortlessly. A sales manager, for instance, can interpret regional sales performance at a glance, facilitating a more informed discussion with marketing counterparts about targeting strategies.
Estimate the Total Number of Users: Uniting Stakeholders
BI dashboards provide a centralized hub where stakeholders from different departments can converge, fostering a shared understanding of business performance. With features to estimate the total number of users accessing the dashboard, organizations gain insights into which teams are actively engaging with the data. This insight encourages cross-functional conversations, enabling departments to align their goals and strategies based on a collective comprehension of the data’s implications. Finance teams can collaborate with operations teams to optimize resource allocation, while HR departments can tailor talent acquisition efforts based on real-time market trends.
Performance Tracking and Accountability: Fostering a Culture of Transparency
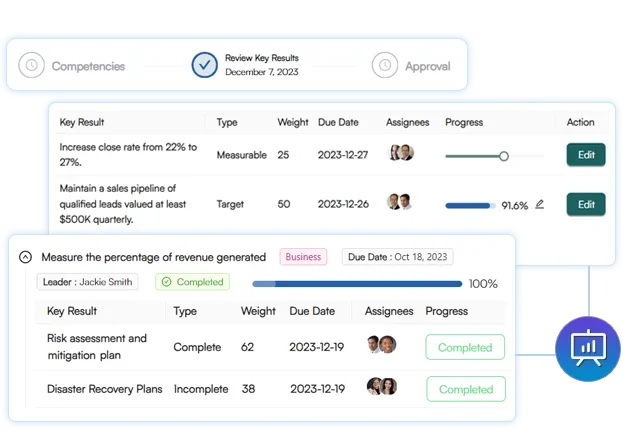
Collaboration thrives in an environment of transparency and accountability. BI dashboards excel in providing performance-tracking capabilities, enabling teams to monitor progress against key performance indicators (KPIs) in real-time. When these metrics are accessible to all stakeholders, it fosters a sense of shared responsibility for achieving organizational targets. Marketing teams can collaborate more effectively with sales teams by analyzing campaign effectiveness in relation to lead conversion rates. This data-driven approach not only streamlines communication but also encourages teams to proactively work together to improve results.
Use BI to Streamline Collaboration: A Pathway to Efficiency
In today’s era of remote work and dispersed teams, effective collaboration can be challenging. BI dashboards bridge this gap by offering a central repository of data that teams can access anytime, anywhere. Whether it’s a project manager coordinating tasks with team members spread across the globe or executives making strategic decisions based on up-to-the-minute insights, BI dashboards provide a common platform for all stakeholders. This streamlined access to information enhances communication and decision-making, minimizing delays and ensuring that everyone is on the same page.
Identify Who Will Need Access to BI and Analytics
As we explore the synergy between collaboration, communication, and BI dashboards in this BullseyeEngagement blog, let’s unravel the importance of pinpointing the right individuals who require access to BI and analytics.
1. VP of Sales and Revenue
At the helm of strategic decision-making, the Vice President of Sales and Revenue holds the responsibility of driving top-line growth. Access to BI dashboards equips them with real-time insights into sales trends, customer behaviors, and revenue projections. With a bird’s-eye view of the organization’s sales performance, they can fine-tune strategies, allocate resources judiciously, and guide their team toward achieving ambitious targets.
2. Regional Sales Manager
Spearheading sales efforts in a specific geographic area, the Regional Sales Manager relies on accurate data to optimize operations within their territory. BI dashboards provide them with localized insights, enabling them to tailor strategies that resonate with the nuances of their market. From monitoring inventory levels to identifying emerging opportunities, access to BI dashboards empowers them to make timely decisions that drive regional success.
3. Account Manager
For the Account Manager, nurturing client relationships and ensuring satisfaction are paramount. BI dashboards offer a panoramic view of each client’s journey, from interactions to purchasing patterns. Armed with this information, Account Managers can proactively address concerns, anticipate needs, and present personalized solutions. This level of engagement not only fosters client loyalty but also contributes to revenue growth
Conclusion
Now, as we draw the curtains here are a few things to revisit- While exploring collaboration and communication with Business Intelligence dashboards, one should keep in mind that that these tools work beyond their traditional roles. No longer mere platforms for data presentation, BI dashboards have evolved into dynamic spaces where data-driven insights converge with collaborative efforts, sparking innovation and informed decision-making.
BullseyeEngagement’s commitment to discovering the intricate interplay between collaboration, communication, and BI dashboards underscores the transformative potential of these technologies. From streamlining project management to fostering cross-functional innovation, the marriage of BI dashboards and collaborative tools exemplifies the future of data-driven enterprises.
Avail these benefits for your business, and contact BullseyeEngagement today!
